
BCG Matrix – This term sounded like something too complex until the professor taught this to us during a marketing lecture in my MBA days.
Well, did I understand it entirely after that lecture?
No 🙂 It takes time if you’re completely new to this.
BCG Matrix is a concept that is usually taught in the B-Schools, mostly during marketing sessions. But it is not just a marketing concept. It is a great strategic planning tool.
You would be familiar with the terms Stars, Cash Cows, Dogs & the Question Marks if you have done an MBA or done some management course.
Don’t worry, you don’t have to enroll in an MBA to understand BCG Matrix.
There are a lot of resources online that can help you. You don’t have to go to Google and search for it.
You have landed on the perfect resource to help you understand BCG Matrix.
What is BCG Matrix?
Boston Consulting Group (BCG) Matrix is a 2 by 2 matrix created by BCG’s Founder Bruce Henderson in 1968. It is also known as the Growth-Share Matrix, Boston Box, or Product Portfolio Matrix.
BCG Matrix is a corporate strategy tool. The matrix is used by businesses to analyze their product portfolio and make strategic decisions.
It helps companies to prioritize their different products/businesses by the degree of their profitability.
On the basis of the BCG matrix, businesses decide on which business units must be divested, allocated extra resources, or cash out. It helps in making investment decisions in a strategic manner.
Understanding BCG Matrix
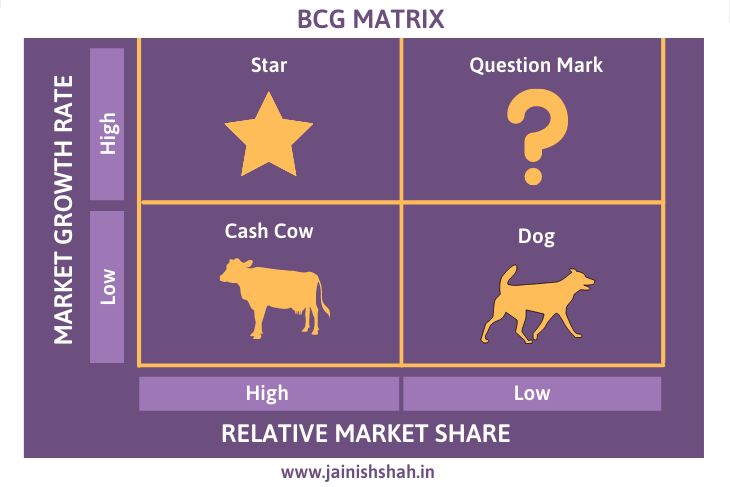
The BCG matrix consists of 4 quadrants with Relative Market Share on X-Axis and Market Growth Rate on Y-Axis.
Relative market share is your company’s market share (revenues) divided by the largest competitor’s market share. It is the measure of the company’s competitiveness.
In simple terms, this is a measure of how much the company is able to sell in the market when compared with competitors.
What is Market Growth Rate?
The market growth rate is the growth percentage of the market & varies from industry to industry. It is the measure of the market’s attractiveness.
A high market growth rate means the demand is growing rapidly. As the demand grows, the business also grows. But in order to meet the demand, businesses have to invest more in resources.
The market growth rate differs from industry to industry.
4 quadrants of BCG Matrix
On the basis of under which quadrant the product/business line falls, the decision can be taken whether to continue with it, wait or discontinue that product or service.
BCG Matrix is comprised of Dogs, Question Marks, Stars & Cash Cows.
Let us understand this in detail.
#1. Dogs
The products/business units in the quadrant of Low Market Growth and Low Market Share are termed Dogs.
Low Market Growth means the demand for the product(s) is less & Low Market Share means the company’s competitiveness for the product is less too.
So ideally, these are the products or business units which are neither have any growth opportunity nor the strength to compete with other similar products.
The recommended action with such products is to get rid of them & redefine the product portfolio.
Imagine you’re investing in a business unit that is not going to fetch any results for you? What will you do? Utilize this money somewhere else. This is the divest strategy.
#2. Question Marks
The products/business units in the quadrant of High Market Growth and Low Market Share are the Question Marks.
High Market Growth means good demand for the product & Low Market Share means less competitiveness.
Now this means that despite the demand, your products in this category are not able to do well.
This gives the company several options. Firstly, a thorough analysis should be done.
- Invest if there are chances of the products becoming Stars
- Divest if there is no such possibility
- Hold if there is a possibility to become Star after some time
#3. Stars
The products that fall under the quadrant of High Market Growth and High Market Share of the product portfolio matrix are the Stars.
These are the products that are in demand in the market & you are having a good share in the market when compared with your competitors.
You must analyze the products in this bucket and try to move products from Stars to Cash Cows.
Though the market growth rate & market share is high, the investment needed in these products is high too.
#4. Cash Cow
The products that fall under the quadrant of Low Market Growth and High Market Share of the BCG Matrix/Boston Box are the Cash Cows.
These are the products that do have a high growth potential rate in the market but have good coverage in terms of the market share.
Just as a cow is a generous animal that gives without expecting anything in return, the products that fall under the Cash Cow quadrant keep on giving cash with minimal investment.
The money generated from these products can be used to leverage Stars.
Limitations of BCG Matrix
- BCG Matrix is quite an old matrix. It might not be applicable in certain scenarios in today’s world.
- The matrix was designed for large conglomerates with a lot of business units. So proper care must be taken while plotting products of a small company.
- High market share doesn’t necesarilly means high profits as they require a huge amount of investment too
- The matrix evaluates businesses as high and low but not as medium
1 thought on “What is BCG Matrix? | Growth-Share Matrix”